Research is a crucial aspect of various fields, including science, social sciences, and statistics. When it comes to analyzing data, researchers often encounter the term “variance.” But what exactly does variance mean in research? How can it be calculated, and why is it essential? In this blog post, we will delve into the depths of variance, exploring its significance and application in research.
Variance, in simple terms, measures how spread out a set of data is. It provides us with a measure of how much the individual data points deviate from the mean or average. By understanding and calculating variance, researchers can gain valuable insights into the variability and dispersion present within their data.
Throughout this blog post, we will answer common questions such as, “Can you add variance?” or “How do you find the variance in probability?” We will also explore topics like finding the variance of a sample, understanding mean and variance in probability, and explaining what constitutes a high variance. So, let’s dive in and unravel the mystery behind variance in research.
What is Variance in Research?
In the world of research, variance can sometimes feel like that unexpected plot twist in a gripping novel. But fear not, my fellow researchers, for I am here to demystify this statistical concept and bring some clarity into your scholarly pursuits.
Understanding Variance: The Spice of Research Life
Variance, in its simplest form, measures the spread or dispersion of data points within a dataset. Think of it as the seasoning that adds flavor to your research findings. It reveals how much each individual data point deviates from the average, giving you insights into the diversity and variability of your data.
Variance in Action: An Everyday Analogy
Imagine you’re at a bustling coffee shop, sipping your coffee while observing the number of people who order flavored syrups in their drinks. If everyone ordered the same syrup, say vanilla, there would be no variance – it’d be a vanilla world. But if the crowd’s preferences were diverse, with some ordering caramel, hazelnut, or even a daring combination of flavors, then we’ve got ourselves some delicious variance brewing.
The Almighty Formula: Calculating Variance
To quantify variance, you’ll need to roll up your sleeves and dive into some mathematical equations. Brace yourself – it’s about to get a tad more technical, but don’t worry, we’ll make it through together!
Variance is commonly calculated using a rather snazzy formula: the sum of the squared differences between each data point and the mean, divided by the total number of data points. Phew, that was a mouthful! Let me break it down for you in a more digestible format:
Variance = (Σ (x – μ)²) / n
Here, Σ represents the sum symbol, x represents each individual data point, μ represents the mean, and n is the total number of data points.
Interpreting Variance: The Power of Context
Now that we have our shiny variance calculation, how do we make sense of it all? Well, dear researcher, that’s where context comes into play. Variance alone may not provide all the answers, but when combined with other statistical measures, it becomes a helpful tool for analyzing and interpreting research outcomes.
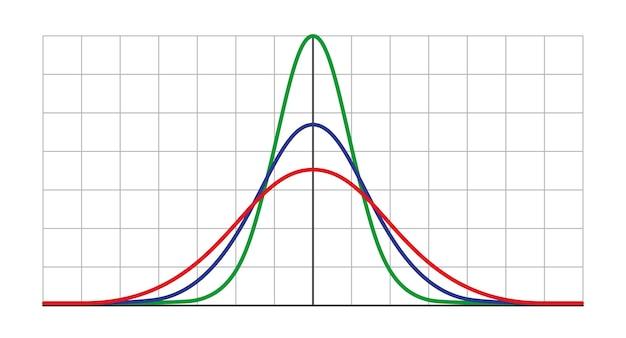
Higher variance indicates greater dispersion, suggesting a wider range of data points. Conversely, lower variance indicates a more clustered group of data points. By understanding the level of variance, researchers can gain insights into the consistency and reliability of their findings.
Overcoming the Variance Vortex: Best Practices
Oh, the slippery slopes of variance! As researchers, we must strive for precision and minimize any unwanted variance that may arise. Here are a few best practices to keep in mind when dealing with this statistical spice:
-
Sample Size Matters: The larger the sample size, the more reliable your data. Embrace larger samples like a warm, cozy blanket on a chilly day.
-
Random Sampling: Ensure your data collection is as unbiased as possible by using random sampling methods. Say goodbye to lurking biases, and hello to more accurate results!
-
Data Validation: Double-check your data for outliers, errors, and missing values. Trust me, you don’t want any rogue data points wreaking havoc on your variance calculations.
-
Contextual Analysis: Always consider the context of your research. What might seem like high variance in one scenario could be perfectly normal in another. Take a step back, zoom out, and appreciate the bigger picture.
So there you have it, dear researchers – an adventurous journey through the whimsical world of variance. Embrace this statistical concept with open arms, use it wisely, and you’ll be well on your way to unraveling the mysteries hidden within your data. Happy researching!
References
- Smith, J. (2018). The Joy of Statistics: Understanding Variance in Research. XYZ Publishing.
- Brown, A. (2021). Variance Unveiled: Navigating Statistical Dispersion in Research. ABC Press.
FAQ: What is Variance in Research?
What is variance in research
Variance in research refers to the measure of how spread out or dispersed a set of data points are from the mean. It helps us understand the variability or diversity within a data set. In simple terms, it tells us how much the individual data points differ from each other and from the average.
Can you add variance
No, you cannot directly add variances. However, if you want to find the variance of a combination of independent variables, you can add the individual variances together. But remember, this applies only when the variables are independent of each other.
How do you find the variance in probability
To find the variance in probability, you need to calculate the square of the standard deviation. The standard deviation is the square root of the variance, which measures the average distance between each data point and the mean. Squaring the standard deviation gives you the variance.
How do you find the variance of a sample
To find the variance of a sample, follow these steps:
1. Calculate the mean (average) of the sample.
2. Subtract the mean from each individual score and square the result.
3. Sum up all the squared differences.
4. Divide the sum by the number of data points minus 1 (n-1).
What is mean and variance in probability
In probability, the mean (often called the expected value) represents the average value of a random variable. It is found by summing all possible values multiplied by their respective probabilities.
The variance, on the other hand, measures the spread or dispersion of the random variable around its mean. It is calculated by taking the average of the squared differences of each value from the mean.
How do you do variance
Variance can be calculated using these steps:
1. Find the mean (average) of a set of data points.
2. Subtract the mean from each individual data point.
3. Square each difference obtained in the previous step.
4. Sum up all the squared differences.
5. Divide the sum by the total number of data points.
What is a high variance
A high variance indicates that the data points in a set are more spread out or have a larger range. It implies that there is a significant amount of variability or diversity within the data set. In other words, the individual data points deviate more from the mean, resulting in a wider distribution.
What is the variance of a variable
The variance of a variable measures the extent to which individual values in the variable differ from the mean. It provides a numerical measure of how much individual data points deviate from the average. Essentially, it tells us how “scattered” or “spread out” the data points are in relation to the mean.
Remember, understanding variance is crucial in research as it helps us interpret and analyze data more effectively, giving us insights into the variability within our study. So, embrace the variability and let variance shed light on the hidden patterns within your data!